Selected work

WaferWatch

I wanted to see if I could write my own rendering engine in Rust and WebAssembly that stays smooth with millions of semiconductor dies on screen, at any zoom.

I built it alone, from the Rust renderer to the review interface.

Open WaferWatch
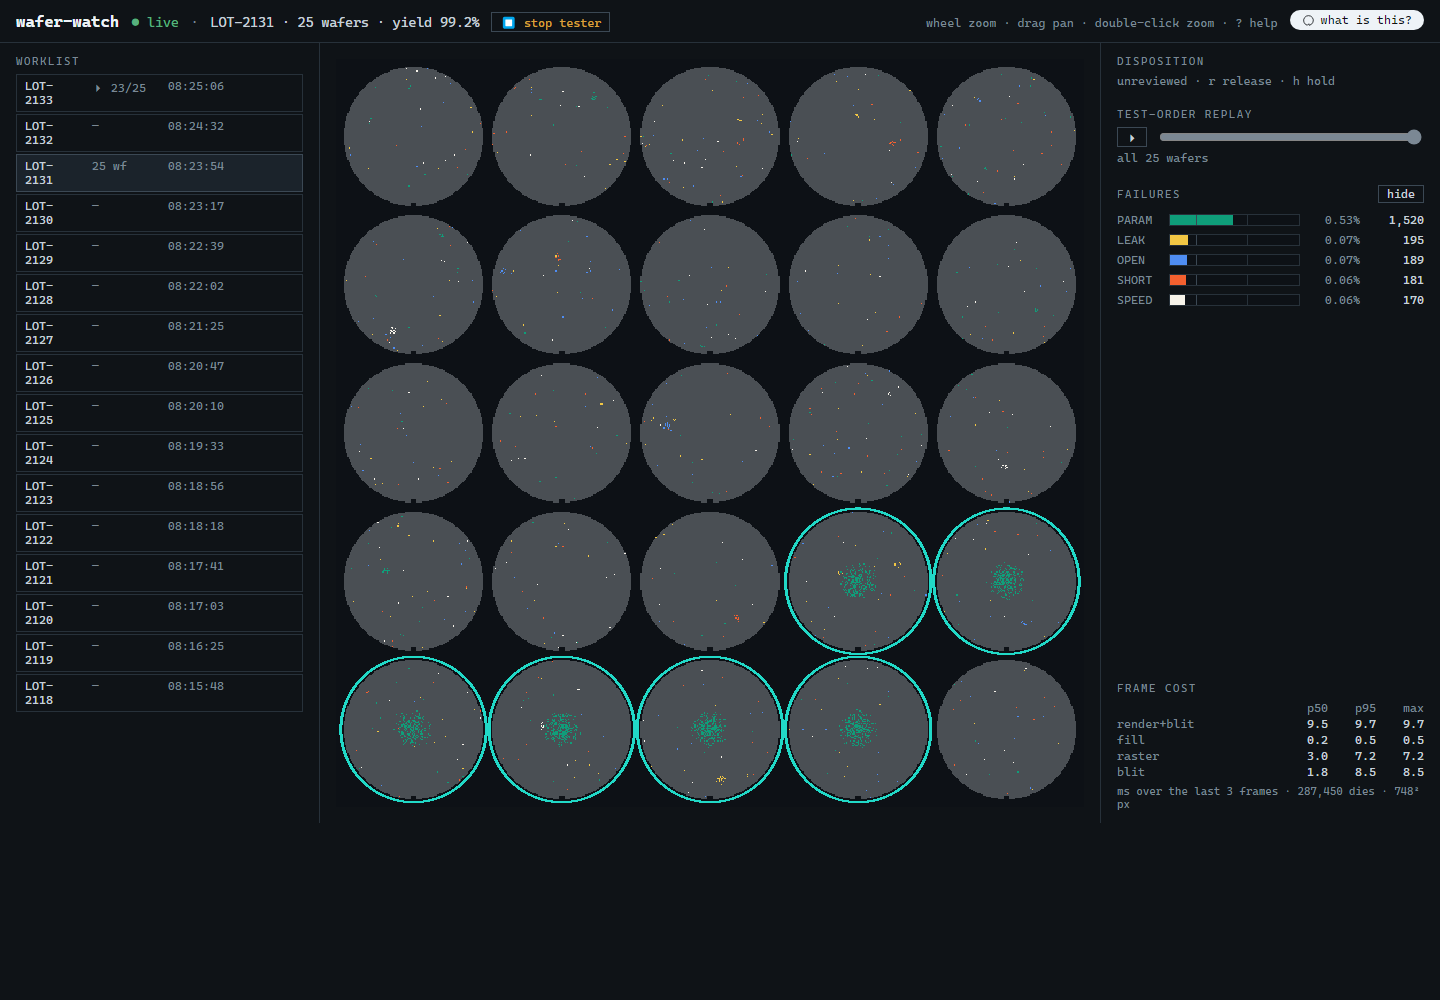
The WaferWatch gallery of 25 wafer maps. Six are ringed in teal as flagged for review, each with green failures clustered at the center.
Detail A: the inspection recording on sheet 2
FIG. 1Reduced to fit

A lot of 25 simulated wafers (FIG. 1, mark 10). Colored failures (FIG. 1, mark 14) form patterns across the gray passing dies, and teal rings (FIG. 1, mark 12) mark the six wafers flagged for review.

Tap a numeral to find it in the figure.

The live site runs a lot of about 2 million dies and redraws it in a few milliseconds, whether the view shows all 25 wafers or a single die.

See the inspection
Title
WaferWatchThe lot gallery
Sheet
1 of 8
Stack
Rust, WebAssembly, Next.js
Data
Simulated lot
Shows
FIG. 1

Detail AReduced to fit

Recorded in the application with simulated data: open a flagged wafer, zoom to individual dies, pan, then return to the lot.

From a lot to a single die.

Getting there meant learning some well-worn tricks. The engine works out the color of each pixel on the canvas, so a frame costs about the same however many dies there are.

It keeps smaller copies of every wafer for zoomed-out views, the way games keep smaller textures, and reads the original die data up close (Detail B).

New wafers are patched in one at a time, so the camera and the gallery never jump.

A cluster of green failing dies visible at close range.

Detail BReduced to fit

A closer view of the same simulated wafer, captured during inspection: the individual dies, with the failing ones in green.
Title
WaferWatchFrom a lot to a single die
Sheet
2 of 8
Stack
Rust, WebAssembly, Next.js
Data
Simulated lot
Shows
Details A and B

FinDash

I wanted to see how far I could take a stock screener on free data alone, in a field where most financial data sits behind paid APIs.

I built it alone, end to end, including the live site.

Open FinDash
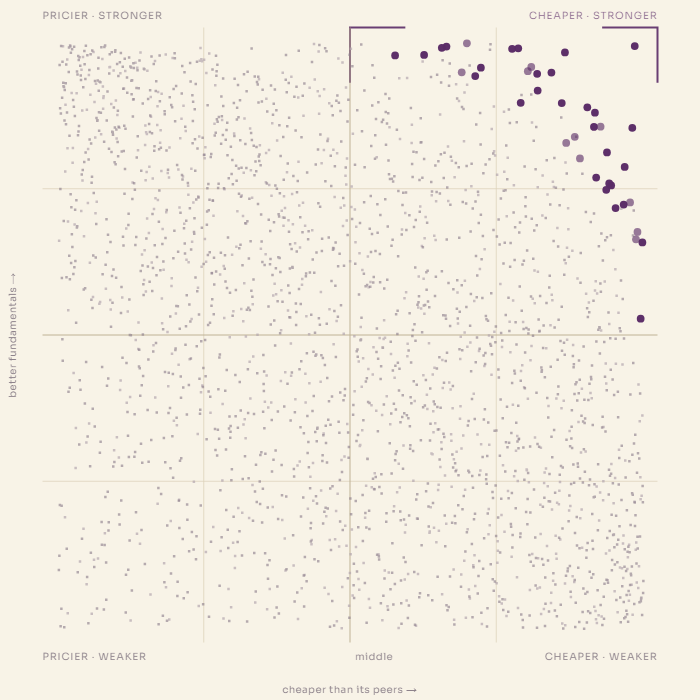
The FinDash scatterplot: companies compared with their peers on value horizontally and reported fundamentals vertically, with the shortlist in the upper-right corner.
FIG. 2Reduced to fit

Right Cheaper than peersUp Stronger reported fundamentals

I kept value (FIG. 2, mark 20) and quality (FIG. 2, mark 22) on separate axes so a low price does not hide weak fundamentals.

It scores about 3,000 US companies against their peers, using free data from Yahoo Finance.

See the shortlist
Title
FinDashThe plot
Sheet
3 of 8
Stack
TypeScript, PostgreSQL, Next.js
Captured
Live site, October 20, 2026
Shows
FIG. 2
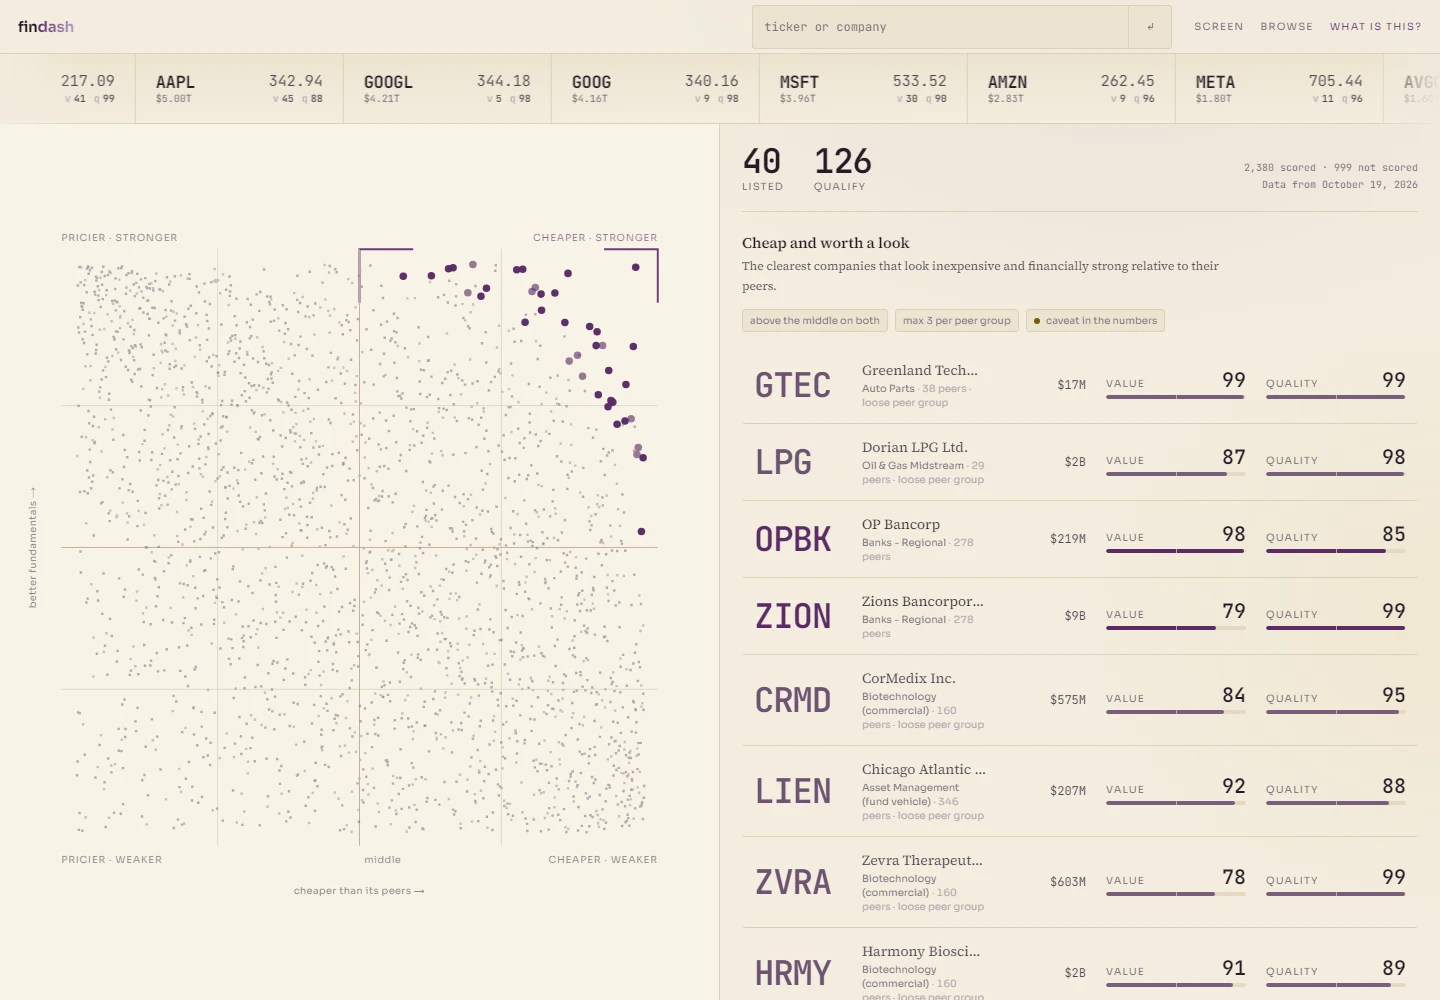
FinDash shortlist entries with separate value and quality scores.
FIG. 3Reduced to fit

Ranked against similar companies.

The upper-right corner contains companies that score well on both axes. The shortlist limits how many come from any one peer group (FIG. 3, mark 30).

Each entry carries separate value and quality scores (FIG. 3, mark 32), and every company page shows the inputs behind them.

The other half of the challenge was making it pleasant to use. Pointing at a company in the list lights its dot on the plot, and each shortlisted dot opens its company page.

Open FinDash
Title
FinDashThe shortlist
Sheet
4 of 8
Stack
TypeScript, PostgreSQL, Next.js
Captured
Live site, October 20, 2026
Shows
FIG. 3

Reader

I wanted a reading list that finds long free articles on its own and learns what I like from how I react to them.

I built it alone: the collector on my PC, the ranking, and the private site.

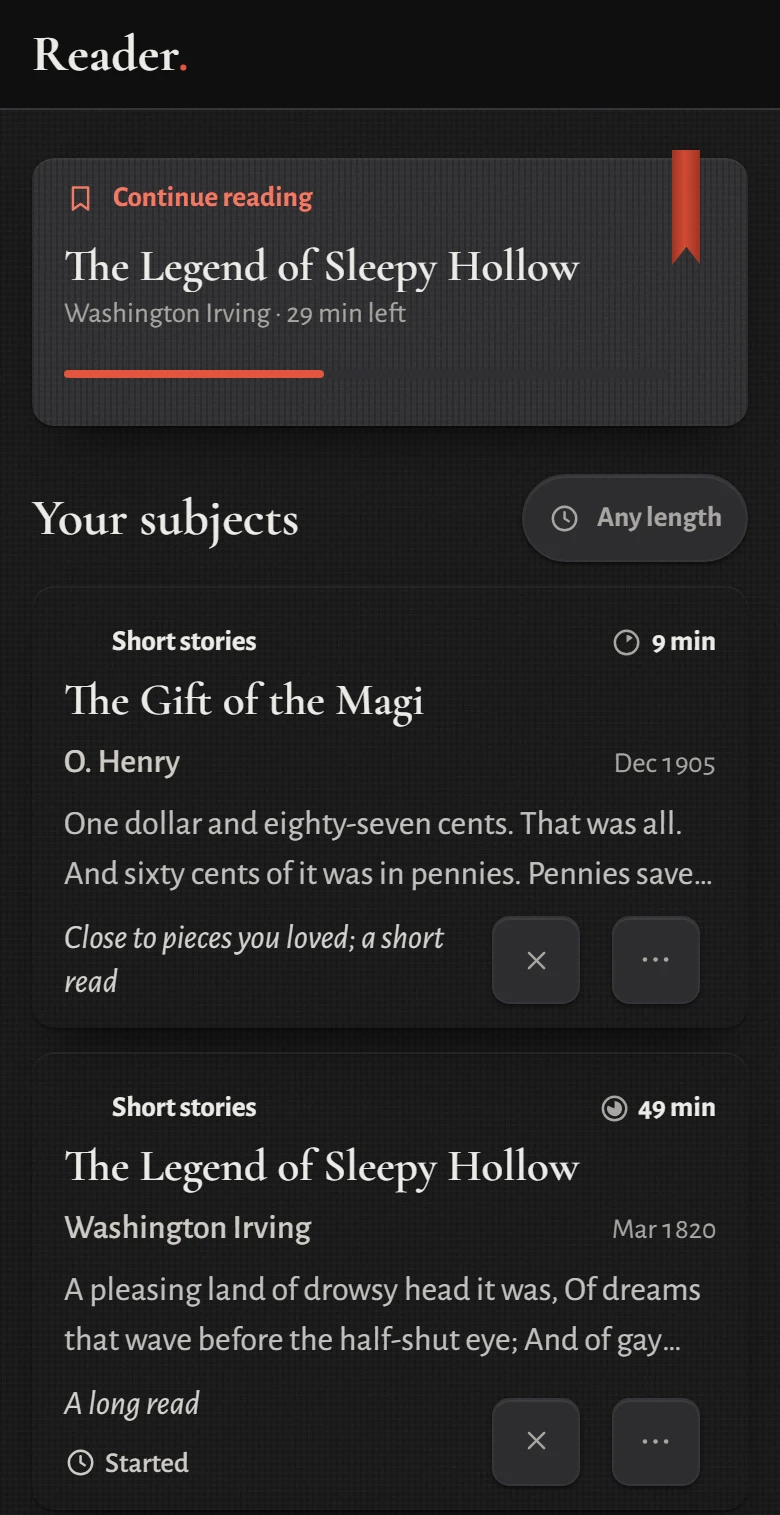
Reader's Top picks on a phone: a half-read story to continue, then story cards with author, reading time, opening lines and the reason each one was picked.
FIG. 4Reduced to fit
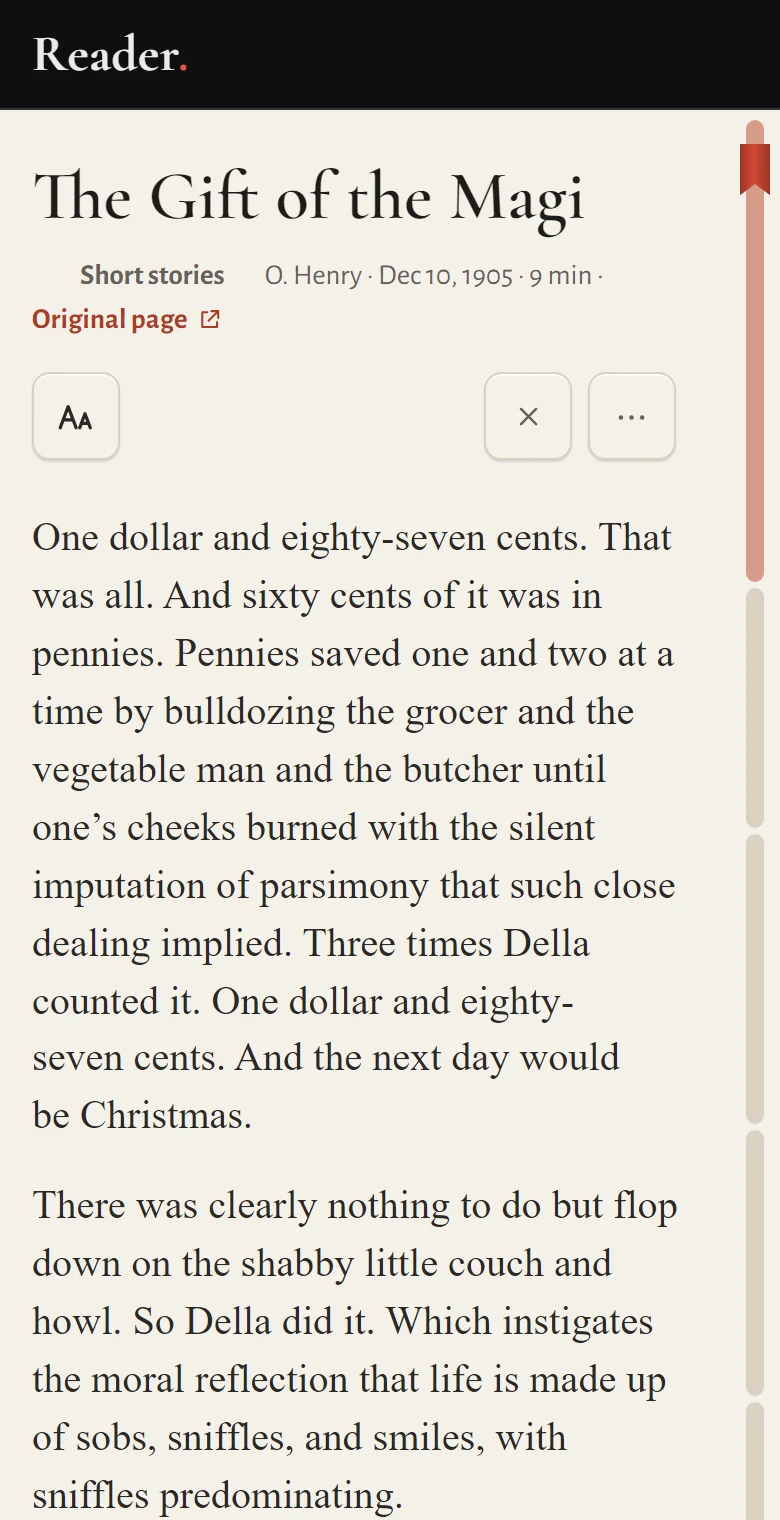
Reader's reading view on a phone: the title, byline and reading time, then the opening paragraphs of the story in large serif type.

Detail CReduced to fit

The reading view: the same type and layout for every article. "The Gift of the Magi" by O. Henry (1905).

Half-read pieces wait at the top (FIG. 4, mark 40). Every card says why it was picked (FIG. 4, mark 42) and how long it takes to read (FIG. 4, mark 44).

A program on my PC collects new pieces every day, checks each one with Claude, and ranks them by how I reacted to similar ones. On my real reactions, a piece I liked outranks one I didn't 80% of the time.

"Anything great" only takes pieces someone outside vouched for: 100 or more Hacker News points, a Longreads pick, or far more Substack likes than the writer usually gets. Every article opens in the same reading view (Detail C).

These captures run on public-domain stories from Project Gutenberg. The real list is private.

Title
ReaderTop picks
Sheet
5 of 8
Stack
Python, Next.js, SQLite, Claude API
Data
Public-domain demo
Shows
FIG. 4, Detail C

HomeSearch

I wanted to compare homes for sale by what each would really cost a month, and by what is around it.

I built it alone, for our own house hunt: the data collector, the costs and the shared site.

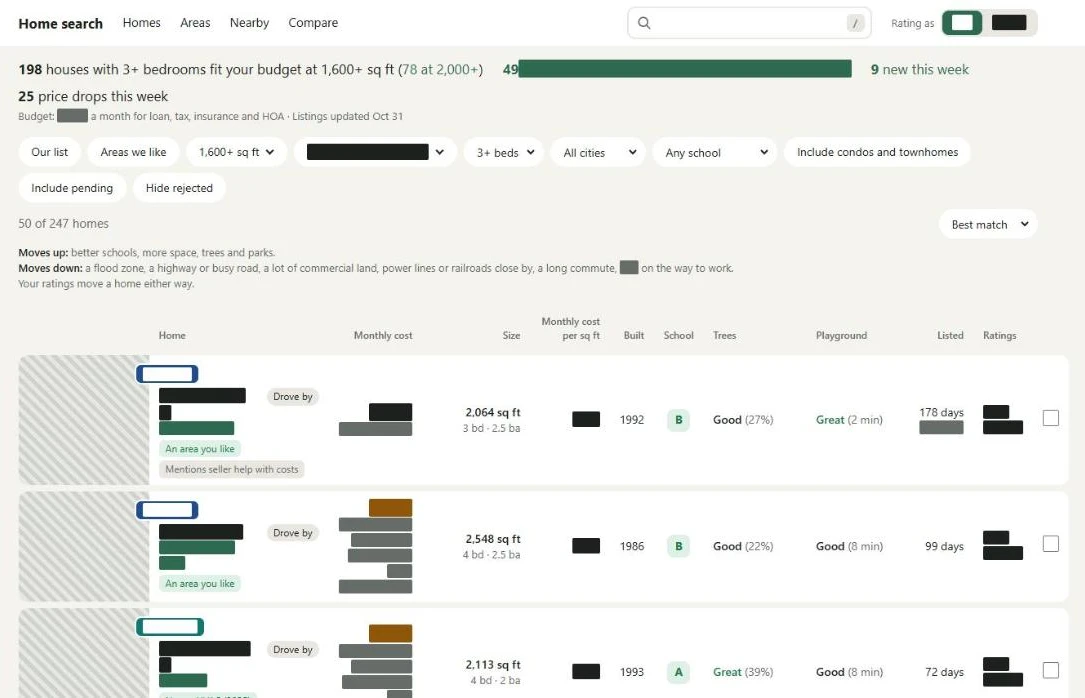
HomeSearch's live homes list with private details barred out: counts of homes that fit, the filters, the ranking rules, and rows showing each home's size, year built, school grade, tree cover and playground distance.

Some info redacted for privacy concerns

FIG. 5Reduced to fit

The list opens on what fits our budget and what is new this week (FIG. 5, mark 50). Homes move up for better schools, more space, trees and parks, and down for flood zones, busy roads and a long commute (FIG. 5, mark 52).

Every home carries its school grade, tree cover and walk to the nearest playground (FIG. 5, mark 54), and a monthly cost that adds the loan, property tax, insurance and HOA.

Listings are joined with county records, census data, flood maps, school ratings and OpenStreetMap, home by home.

The live homes list, with addresses, places, photos, prices, the budget and our names barred out.

Title
HomeSearchThe homes list
Sheet
6 of 8
Stack
Python, Next.js, SQLite
Data
Live, redacted
Shows
FIG. 5

Day to day

I work on the systems behind an online store. I build the integrations that keep the storefront, the ERP and a product configurator in agreement about the catalog, inventory and prices. I also build the scheduled jobs and migrations that move that data, and an internal tool the catalog, marketing and leadership teams use to look things up and make changes. A lot of the work is making sure that when something goes wrong, it fails loudly and can be rerun safely.

FIG. 6Illustrative. Move across the lines to comb them. Swipe sideways across the lines to comb them.
Title
Day to dayAt work
Sheet
7 of 8
Drawing
Illustrative
Shows
FIG. 6

Elsewhere

Step in

Poems, LARP, chess, and Ordir, a world I’m building for a future tabletop campaign.

Title
Will PrattSoftware engineer
Sheet
8 of 8

Get in touch

wpratt353@gmail.com